A graph is a very general means of representing relationships between entities. A probabilistic graphical model (PGM) uses a graph to represent the dependency structure between random variables. When working with multivariate quantities, the joint distribution of those quantities is of utmost importance. As the dimensionality of those quantities grows, estimating the full joint distribution quickly becomes intractable. The basic premise of most probabilistic graphical models is that there are a few strong relationships between random variables, but most relationships are weak once these strong ones are accounted for (this is obviously stated more formally). Hence, one can understand the joint distribution by understanding a relatively small number of relationships represented as graphical edges. Examples of real-world scenarios that can be modeled with probabilistic graphical models are social networks and criminal syndicates.
Recommended Books
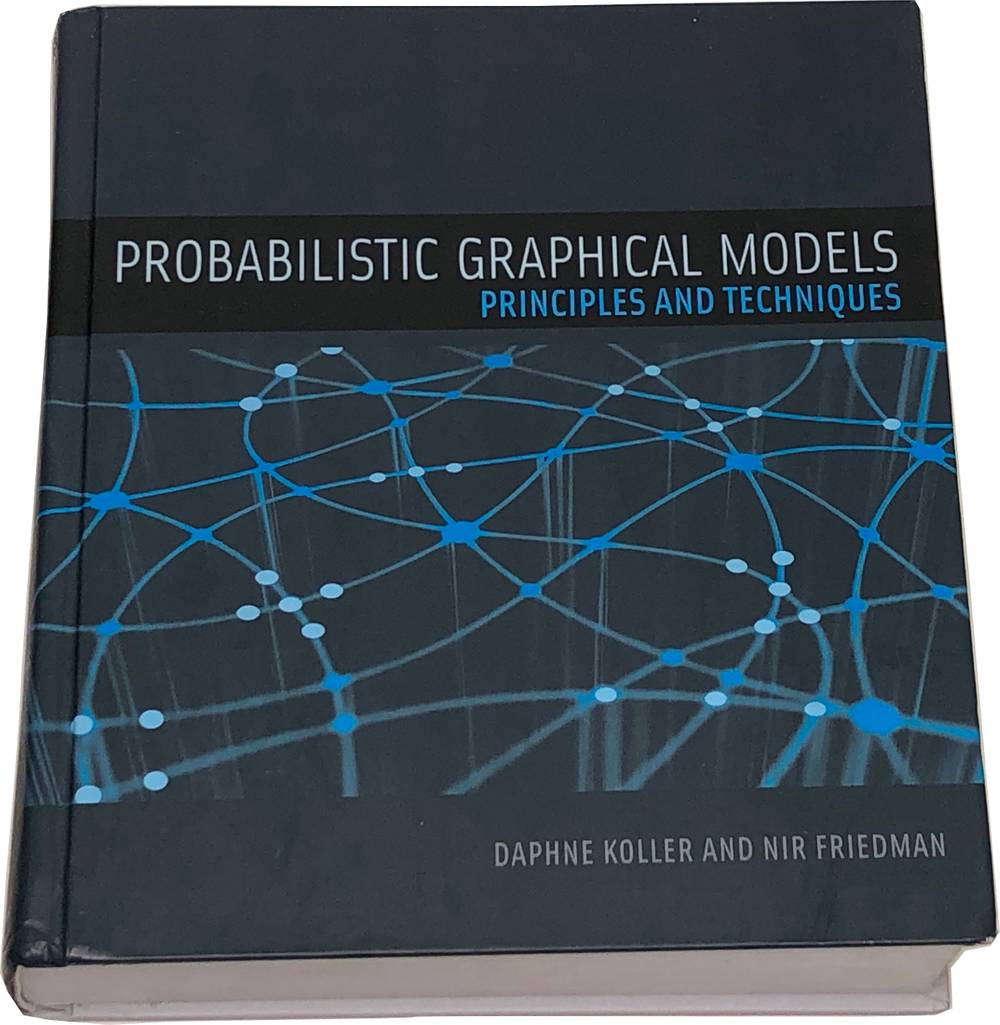
Probabilistic Graphical Models: Principles and Techniques
Daphne Koller And Nir Friedman

Key Features
- In-text exercises
- Errata etc.
Description
Sparsity with edges has not translated into sparsity with words with this book, which is 1200+ pages long despite the fact that the exercises are written in size-amoeba font and it contains neither exercise solutions nor code examples (there is pseudocode). We can begin to forgive the authors' attempt to make trees an exclusively graphical model concept as the coverage of probabilistic graphical models is quite extensive. The book is divided into four parts, an introduction to probabilistic graphical models, a section on inference, a guide to fitting PGMs, and a section on
Actions and Decisions,
which contains a nice section on causality. This text is very readable; if you're interested in this perspective on probability, we doubt you'll find another book that is as comprehensive and straightforward as this one.